Performance overview - Bond Strategy
This Strategy is designed for investors seeking:
A more tactical alternative to their existing bond allocation that can better adjust to rising interest rates.
More consistent and steady returns along with lower volatility than the aggregate bond market
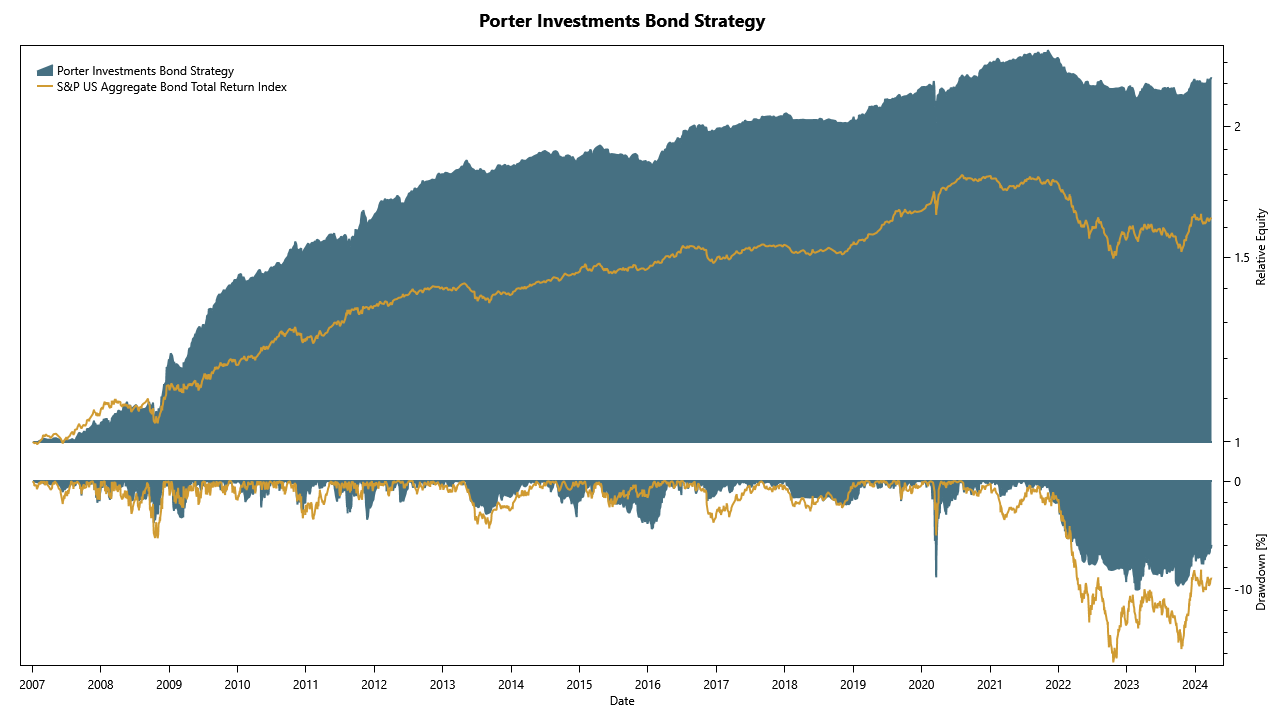
Growth of One Dollar versus Benchmark

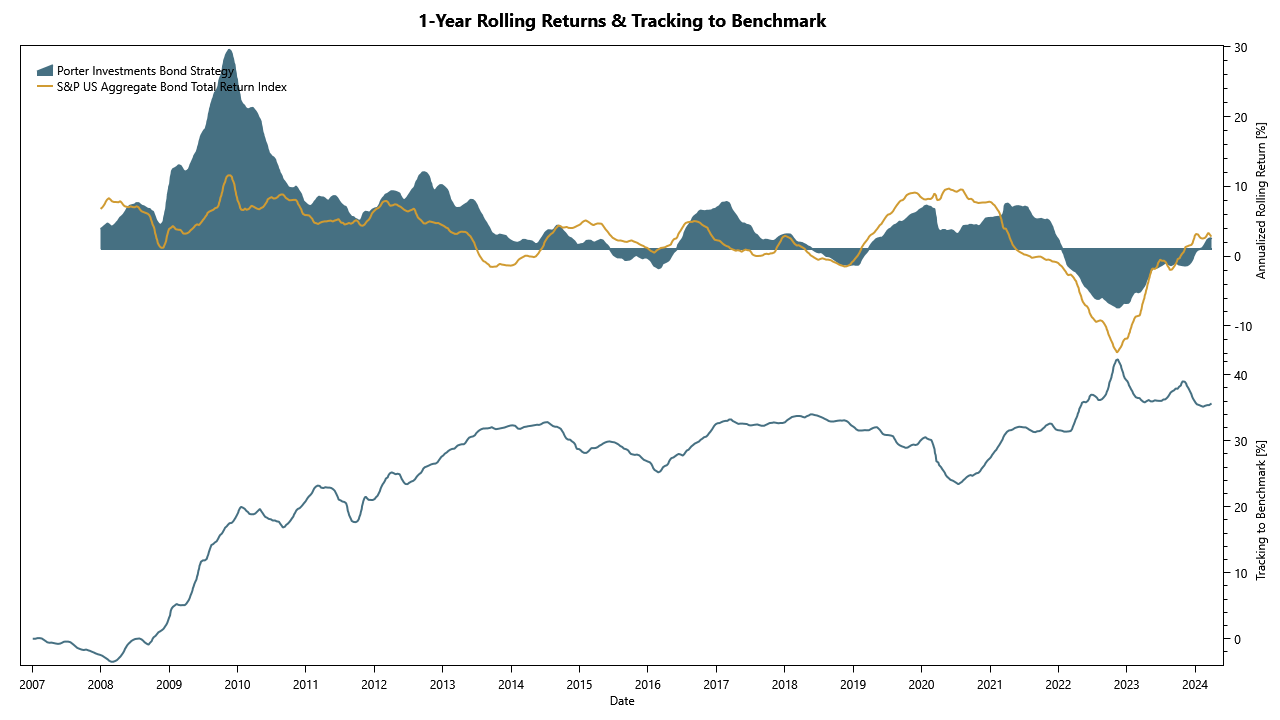
Rolling Returns and Tracking to Benchmark

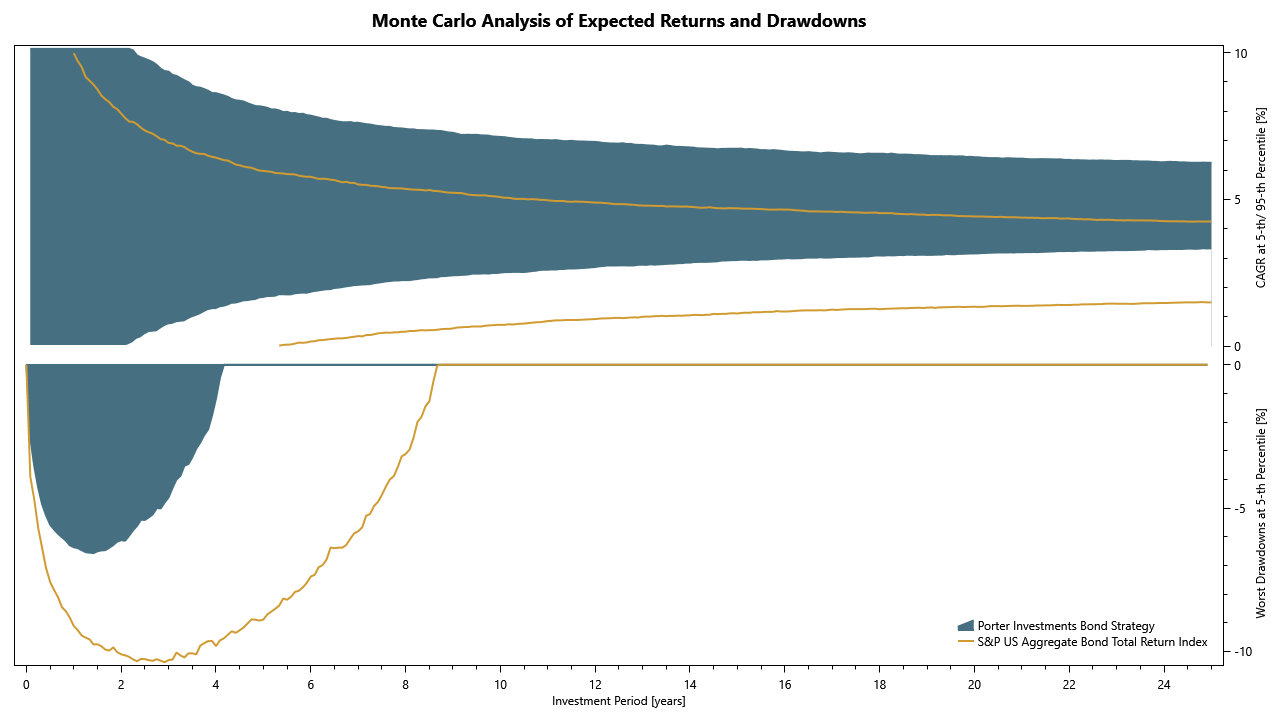
Probability of returns over time versus Benchmark
(at 5th/ 95th percentiles)

Click for an explanation of metric terms.
The Compound Annual Growth Rate (CAGR) is the mean annual growth rate for the period. It is a formula that smooths the variability of the annual returns, providing a constant rate of return. The CAGR is NOT the same as the average annual return, which has limitations when comparing investments. While the CAGR attempts to provide a constant rate, all investment returns will fluctuate from month to month or year to year. The Standard Deviation of Returns (StDev) measures that fluctuation or volatility. Please note that when the Standard Deviation is greater than the CAGR, there is a much greater risk of losing money over a one-year period. When a Strategy's value drops in price from a previous high, this creates a drawdown. The Maximum Drawdown is the greatest percentage loss, calculated daily, that has been experienced from an all-time high in price. Maximum Flat Days is the maximum days it took to travel between two consecutives all-time highs. Sharpe Ratio is a commonly used measure for risk adjusted returns. It is basically the CAGR divided by the Standard Deviation, minus a risk-free rate of return. This is done in an attempt to measure the amount of risk a Strategy is assuming, or put another way, that amount in excess risk it has historically taken on compared to not taking any risk at all. We assume there is no risk in a 3-month US Treasury Bill and that is used to represent the risk-free rate. Sharpe Ratios can be calculated in different ways and hard to compare, but for this illustration, the higher number is better. The Ulcer Index measures risk by analyzing the daily drawdowns. This calculation gives greater weight to larger drawdowns. This should be viewed as a drawdown percentage that will frequently occur. When comparing two investments, a lower number is favorable. The Ulcer Performance Index, or Martin Ratio, measures risk adjusted returns. It attempts to show how well the Strategy compensates you for the risk you assume. When comparing, a higher number if favorable. For example, if one investment had a UPI of .5 another one had 1.0, the second one produces twice the return per unit of risk than the first.
The Disclosure page contains important information regarding the data on this page.

![]()

